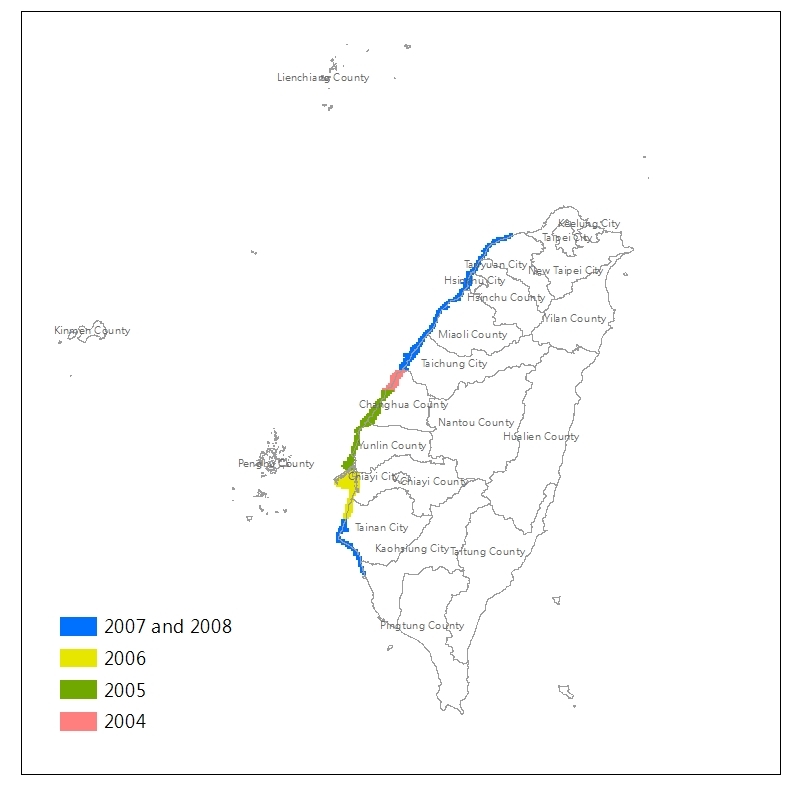
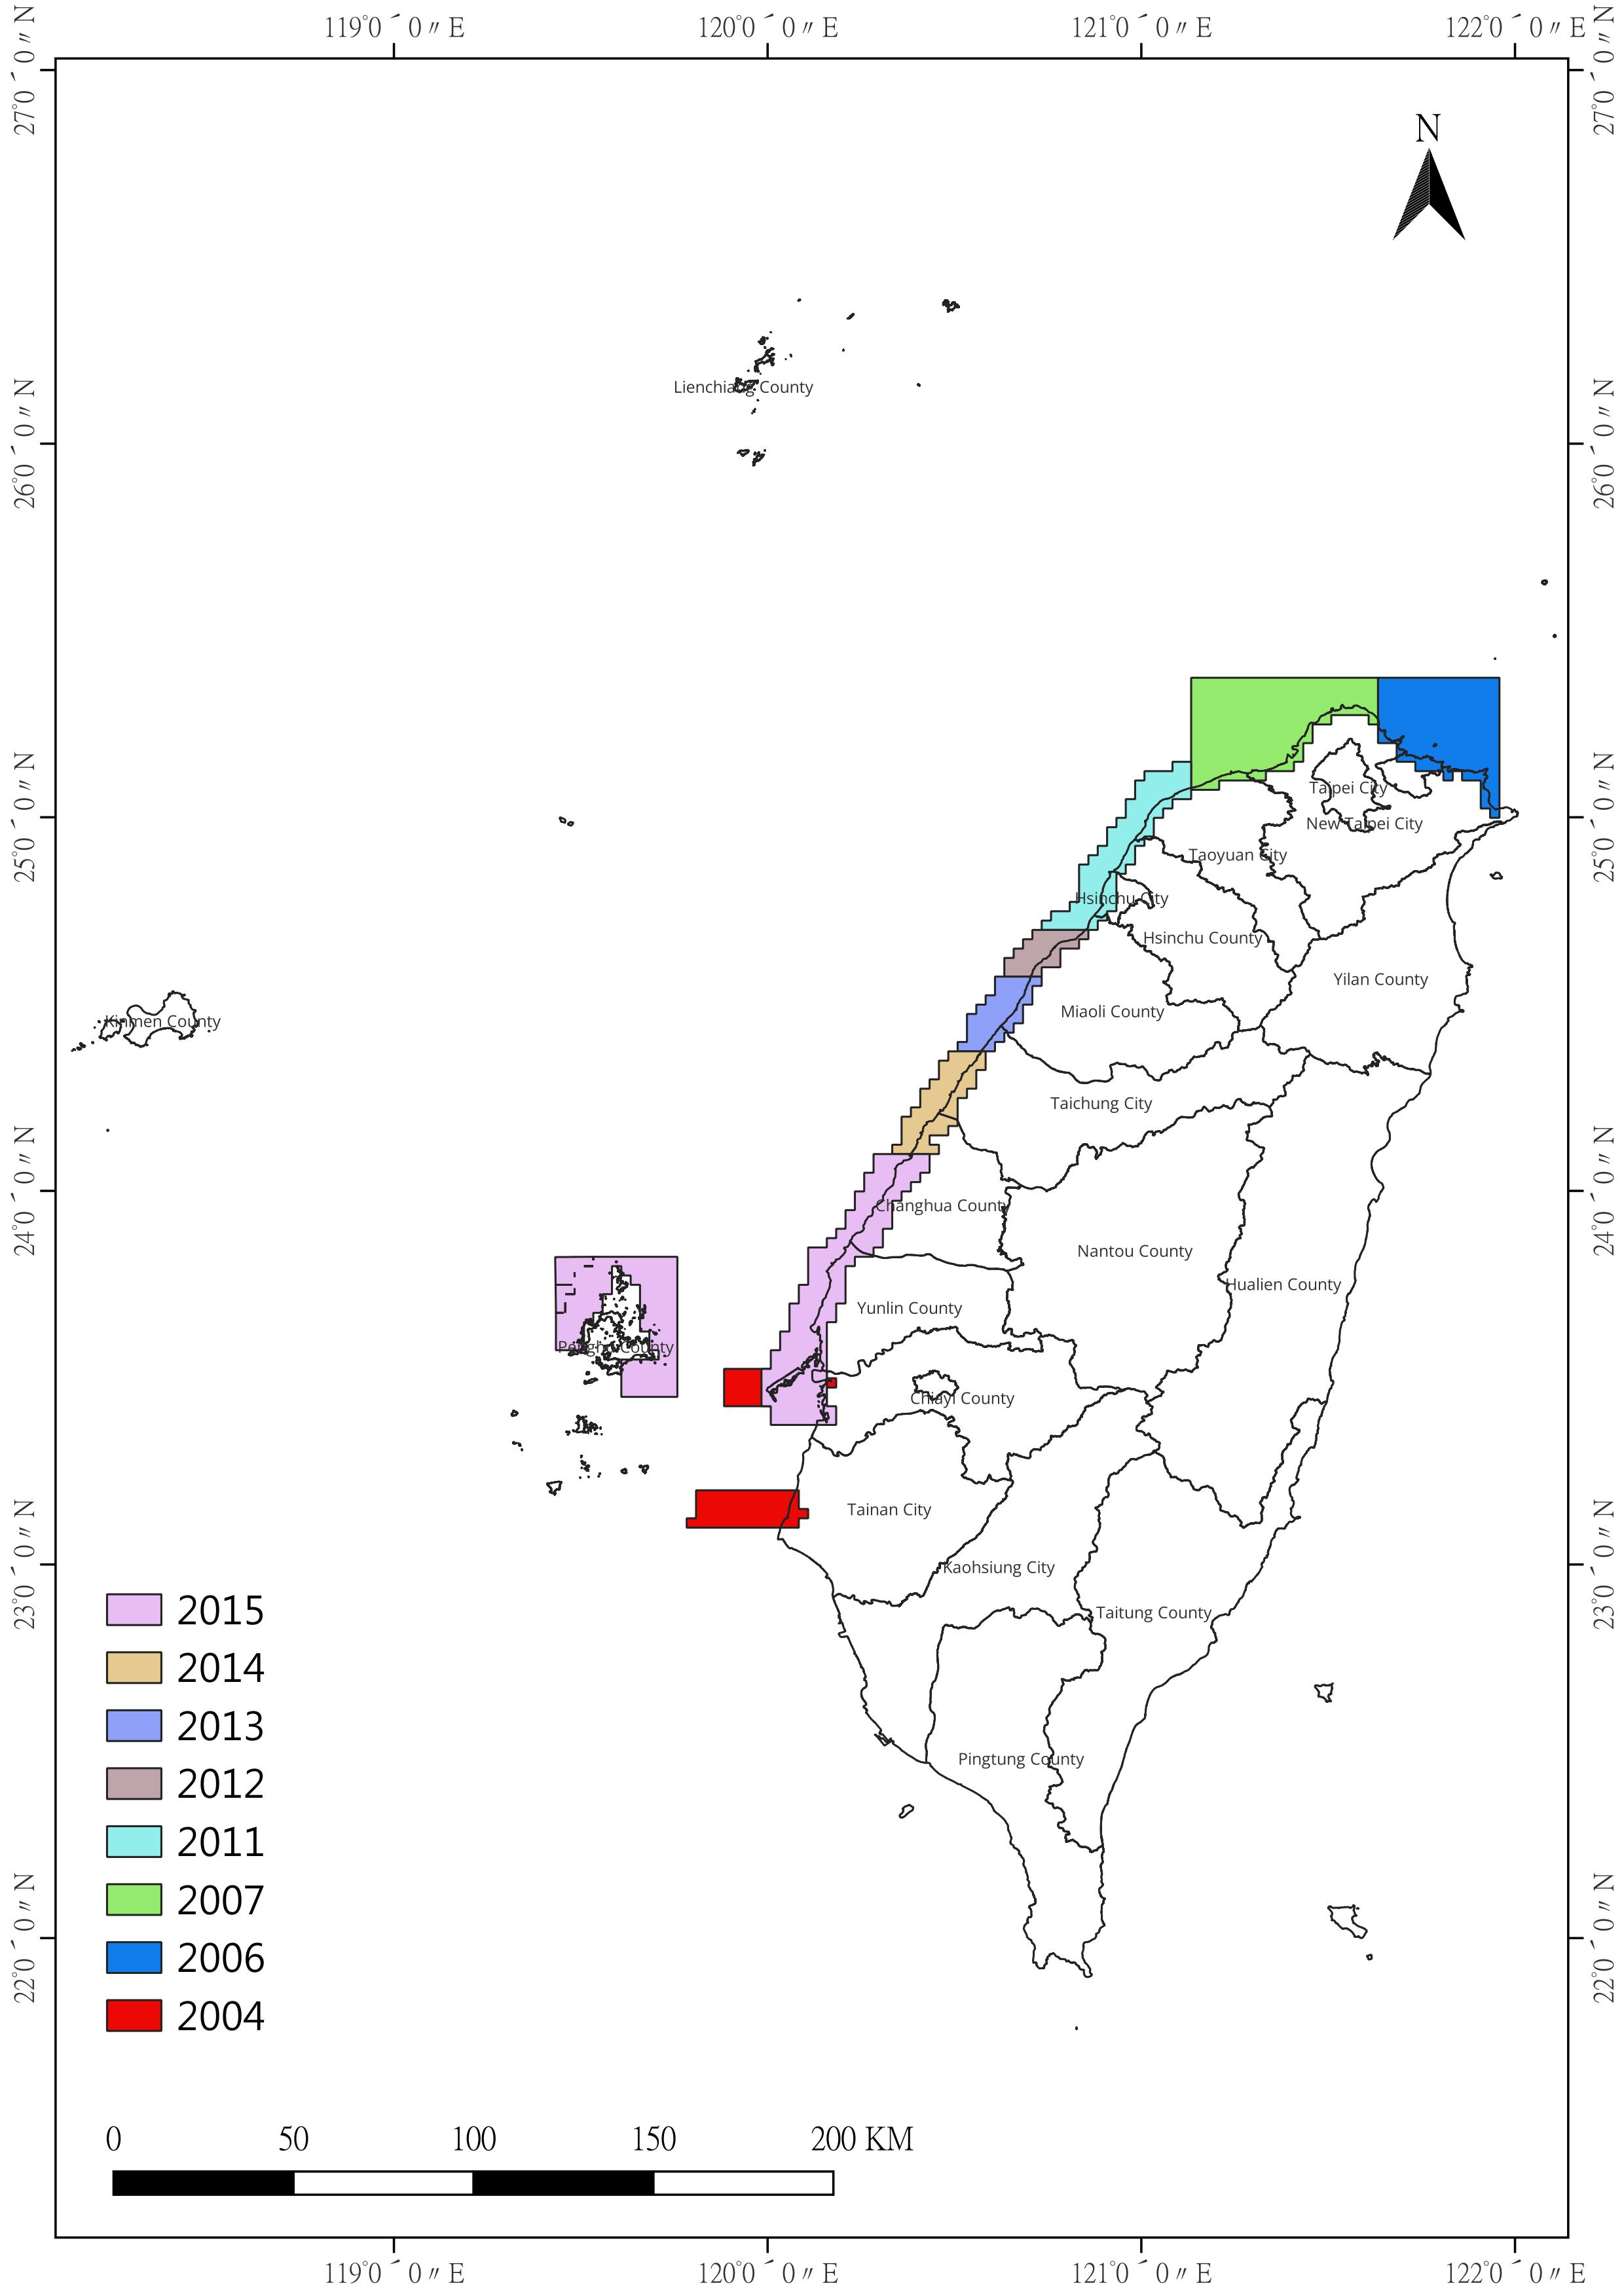
Taiwan is surrounded by the sea, and the lives of its people are closely intertwined with the ocean. To acquire foundational maritime data, we have been conducting surveys since 2004, including intertidal zone topography (2004-2008) and marine base maps (2004-2015). The intertidal zone topography surveys utilized a single-beam echo sounder system combined with airborne LiDAR system measurements, while the marine base maps employed a multi-beam echo sounder system (MBES). The surveyed areas and regions are shown in Figures 1 and 2, and the statistical data are presented in Tables 1 and 2.
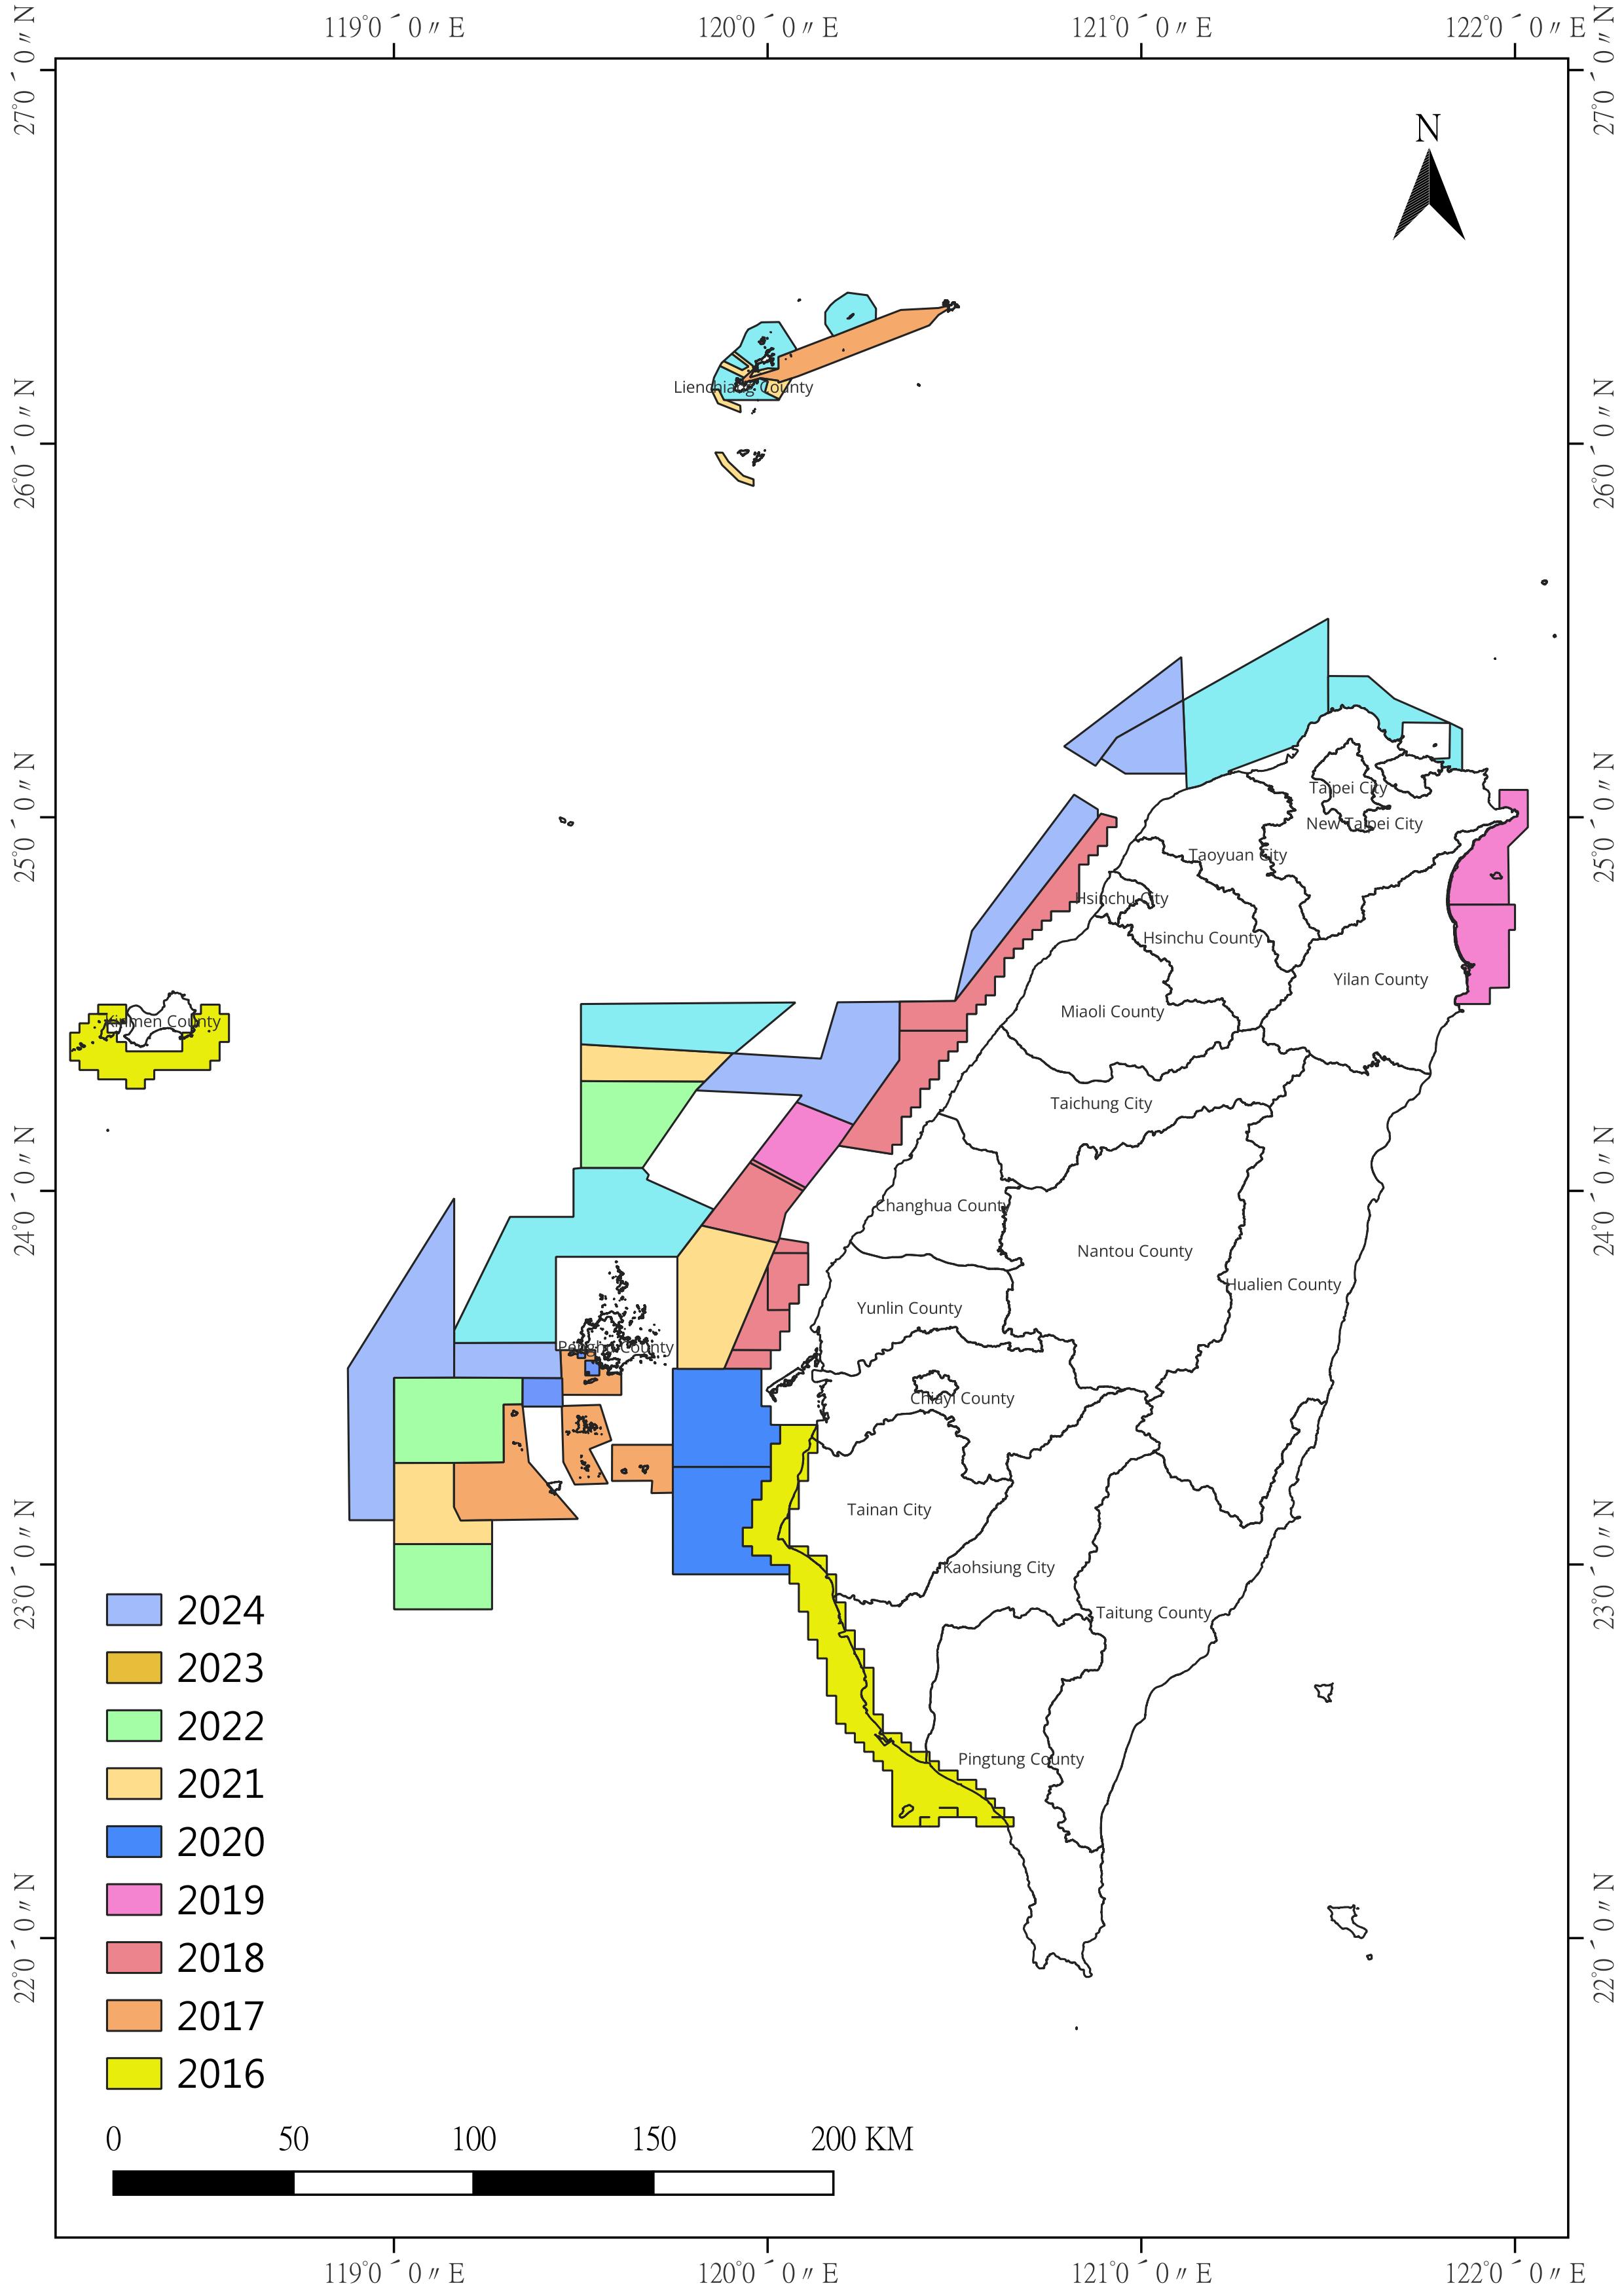
With the development of shipping and fisheries, maritime safety has become increasingly important. In 2008, the International Maritime Organization (IMO) decided to replace paper nautical charts with Electronic Navigational Charts (ENC) as the global standard for marine navigation to enhance maritime safety. Because ENC has become the universal charting data for vessels, so we have adjusted our work from producing base charts of maritime areas to collecting bathymetric data with MBES and establishing the preliminary data for ENC since 2016. The measurement range over the years is shown in Figure 3, and the statistical data is presented in Table 3.

Figure.1 The intertidal zone topographic mapping regions
Table.1 Statistics of intertidal zone topographic mapping
|
Conduct year
|
Maps at the scale of 1:5000 (sheets)
|
Mapping area(km2)
|
| 2004 |
74 |
110 |
| 2005 |
209 |
300 |
| 2006 |
178 |
230 |
| 2007-2008 |
421 |
430 |
| Total |
882 |
1,070 |

Figure.2 The marine base maps mapping regions
Table.2 Statistics of marine base maps mapping
|
Conduct year
|
Maps at the scale of 1:5000 (sheets)
|
Mapping area(km2)
|
| 2004 |
42 |
500 |
| 2006 |
61 |
820 |
| 2007 |
82 |
1,000 |
| 2011 |
84 |
464 |
| 2012 |
27 |
140 |
| 2013 |
38 |
206 |
| 2014 |
51 |
274 |
| 2015 |
278 |
1,640 |
| Total |
663 |
4,944 |

Figure.3 The ENC preliminary data establishing regions
Table.3 Statistics of ENC preliminary data establishing
|
Conduct year
|
Maps at the scale of 1:5000 (sheets)
|
Mapping area(km2)
|
| 2016 |
306 |
1,902 |
| 2017 |
331 |
1,585 |
| 2018 |
279 |
1,512 |
| 2019 |
291 |
1,494 |
| 2020 |
255 |
1,543 |
| 2021 |
374 |
1,756 |
| 2022 |
359 |
1,957 |
| 2023 |
796 |
4,120 |
| Total |
2,991 |
15,869 |